Financial Reports
In 2014, Asha for Education changed its accounting from a Cash-basis of accounting to a GAAP-compliant accrual basis of accounting. Detailed financial reports of Asha, including a copy of the report by an independent auditor, can be found here.
Also, please note Asha chapters in Canada, Europe and India fundraise and disburse from both their local accounts and the U.S. account, but this statement is limited to activities in the U.S. only.
Statement of Activities
| Support and Revenues | Unrestricted | Temporarily Restricted | Total |
| Contributions | $2,558,115 | $187,743 | $2,745,858 |
| Special event revenue | $203,745 | $203,745 | |
| Less: Cost of Benefit to Donors | ($144,607) | ($144,607) | |
| Merchandise Sales | $1,686 | $1,686 | |
| Interest Income | $42,243 | $42,243 | |
| Net assets released from restriction | $176,165 | ($176,165) | – |
| Total support and revenues | $2,837,347 | $11,578 | $2,848,925 |
| Expenses | |||
| Program Services | $2,849,141 | $2,849,141 | |
| Management and General | $74,064 | $74,064 | |
| Fundraising | $31,806 | $31,806 | |
| Total Expenses | $2,955,011 | $2,955,011 | |
| Change in Net assets | ($117,664) | $11,578 | ($106,086) |
| Net assets, beginning of year | $9,124,290 | 94153 | $9,218,443 |
| Net assets, end of year | $9,006,626 | $105,731 | $9,112,357 |
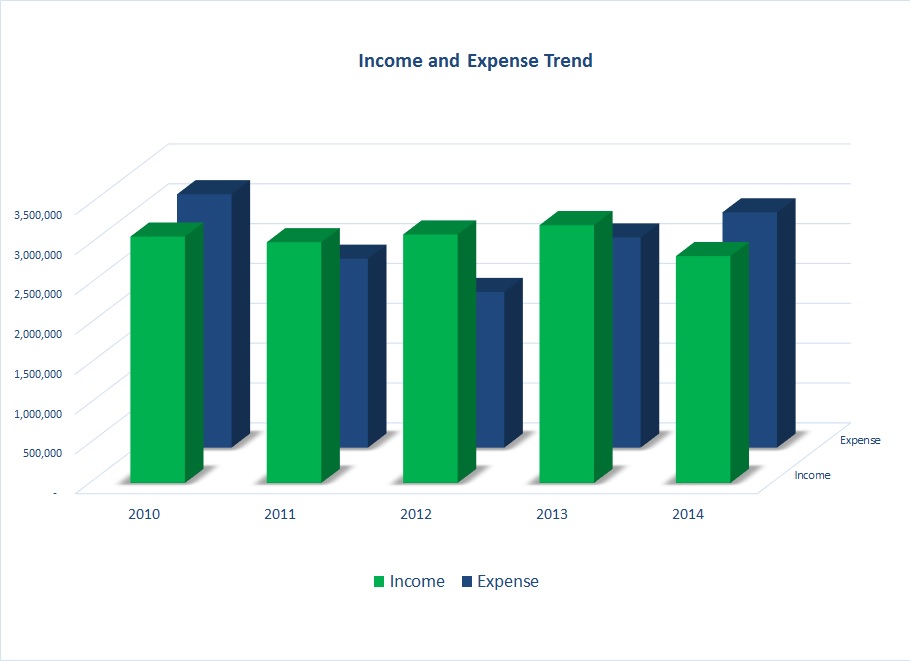
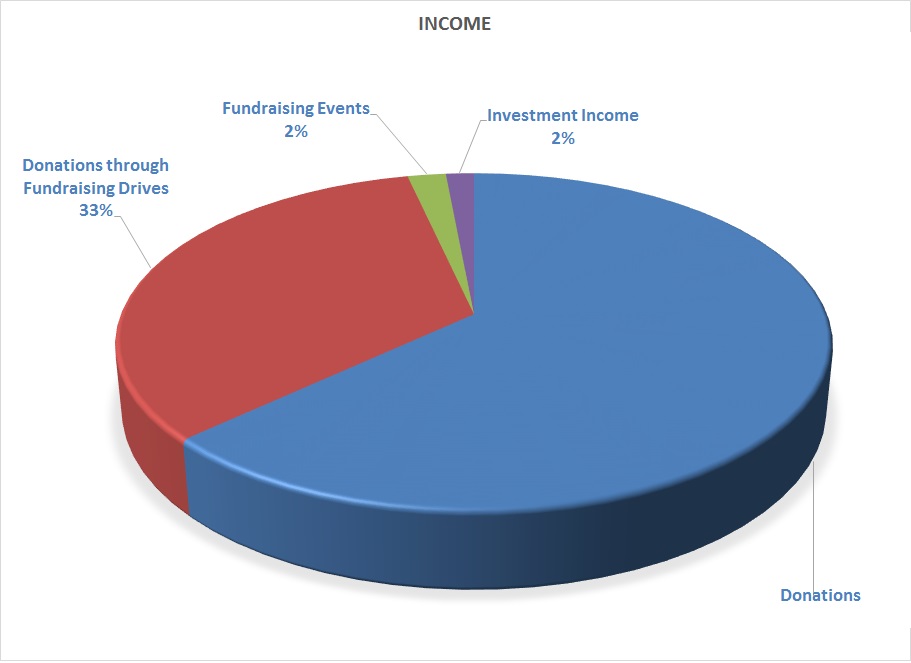
Income and Expense Details – Overall
The following graphs show the overall income/expenses over the last 5 years and the sources of our income. Net income from fundraisers and investments form only 4% of our total income while 96% of the income is from tax-exempt donations.
Statement of Functional Expenses
| Program Services | Management and General | Fundraising | Total Expenses | |
| Project Disbursement | $2,849,141 | $2,849,141 | ||
| Accounting Fees | $43,649 | $43,649 | ||
| Administrative Expenses | $10,468 | $10,468 | ||
| Advertising | $453 | $453 | ||
| Bank Charges | $16,754 | $16,754 | ||
| Credit Card processing fees | $25,741 | $25,741 | ||
| Equipment rental | $2123 | $2123 | ||
| Merchandise | $3226 | $3226 | ||
| Postage and shipping | $3193 | $3193 | ||
| Printing and publications | $263 | $263 | ||
| Total Expenses | $2,849,141 | $74,064 | $31,806 | $2,955,011 |
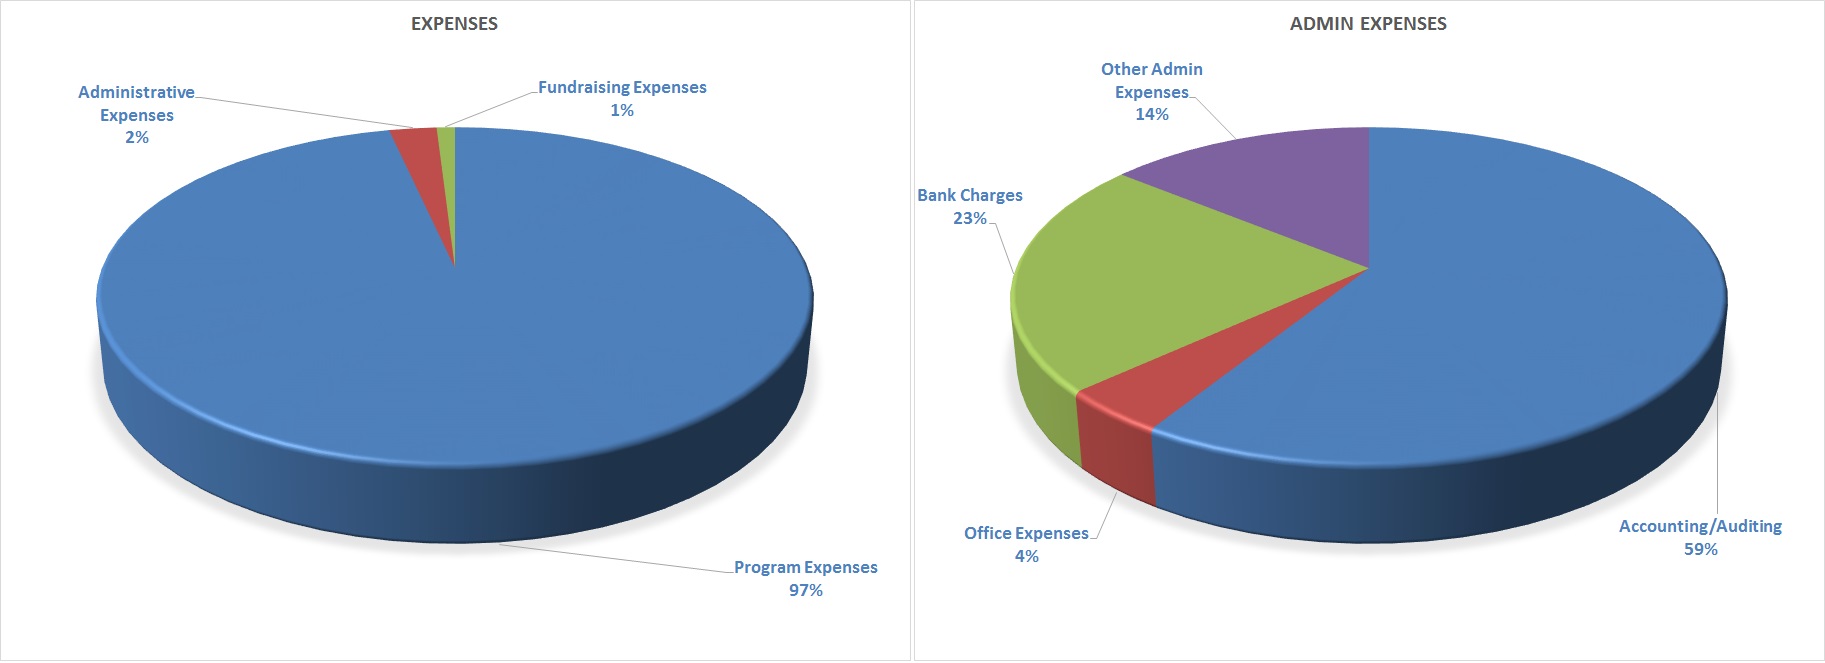
The following graphs show the overall distribution of expenses. Almost 97% of our funds are used to support projects in India. Administrative expenses account for only 2.4% of the total expenses – a majority of which is towards accounting/auditing and bank charges.
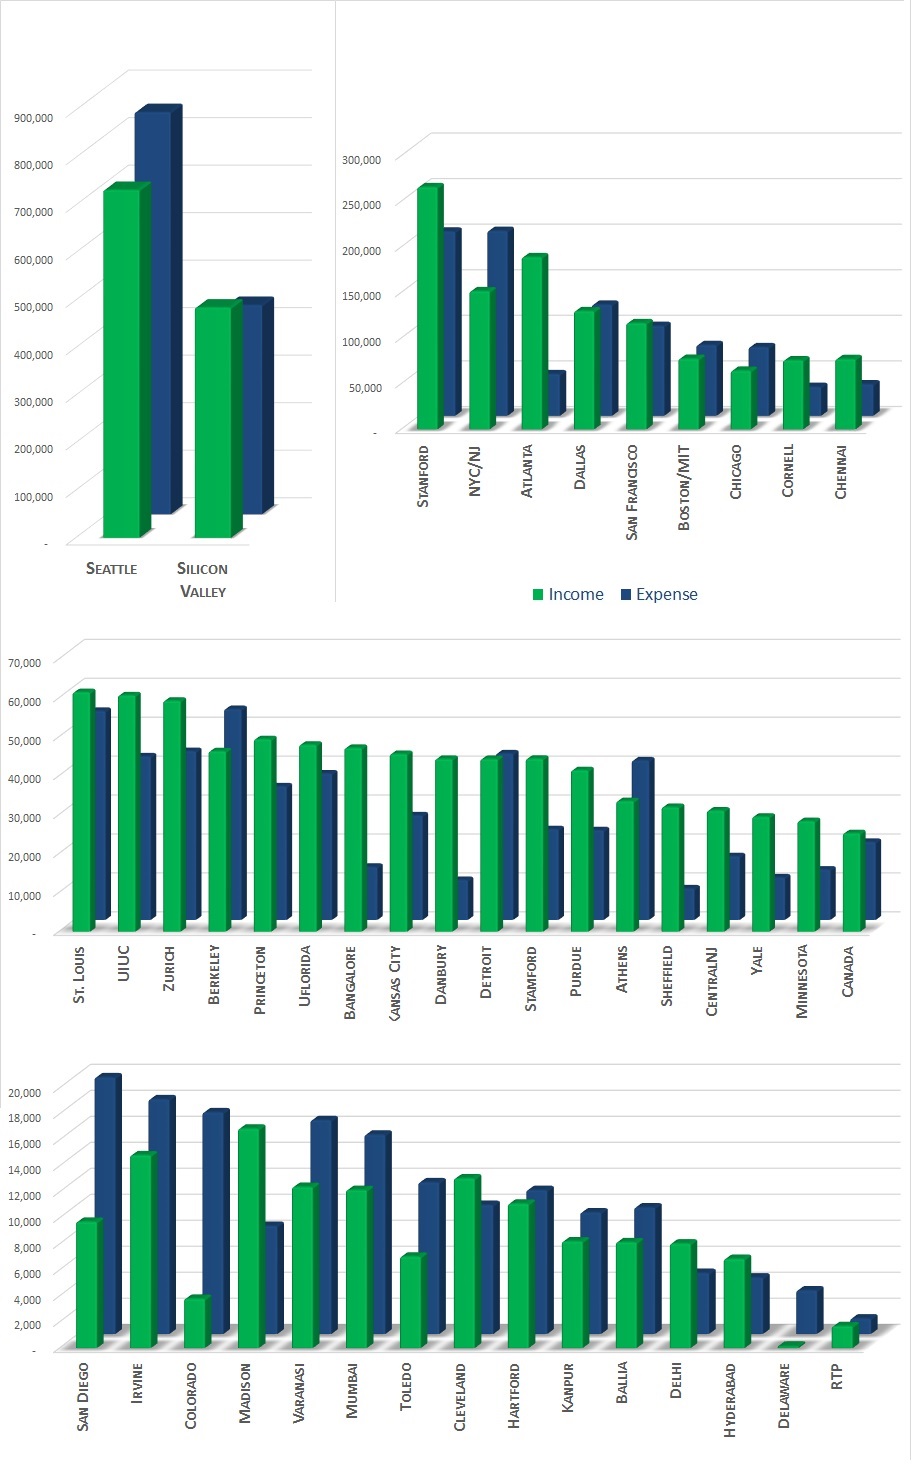
Income and Expense Details – By Chapter
The following graphs show the income and expenses, per chapter, in 2014. Please note Asha chapters in Canada, Europe and India fundraise and disburse from both their local accounts and the U.S. account, but this statement is limited to activities in the U.S. only
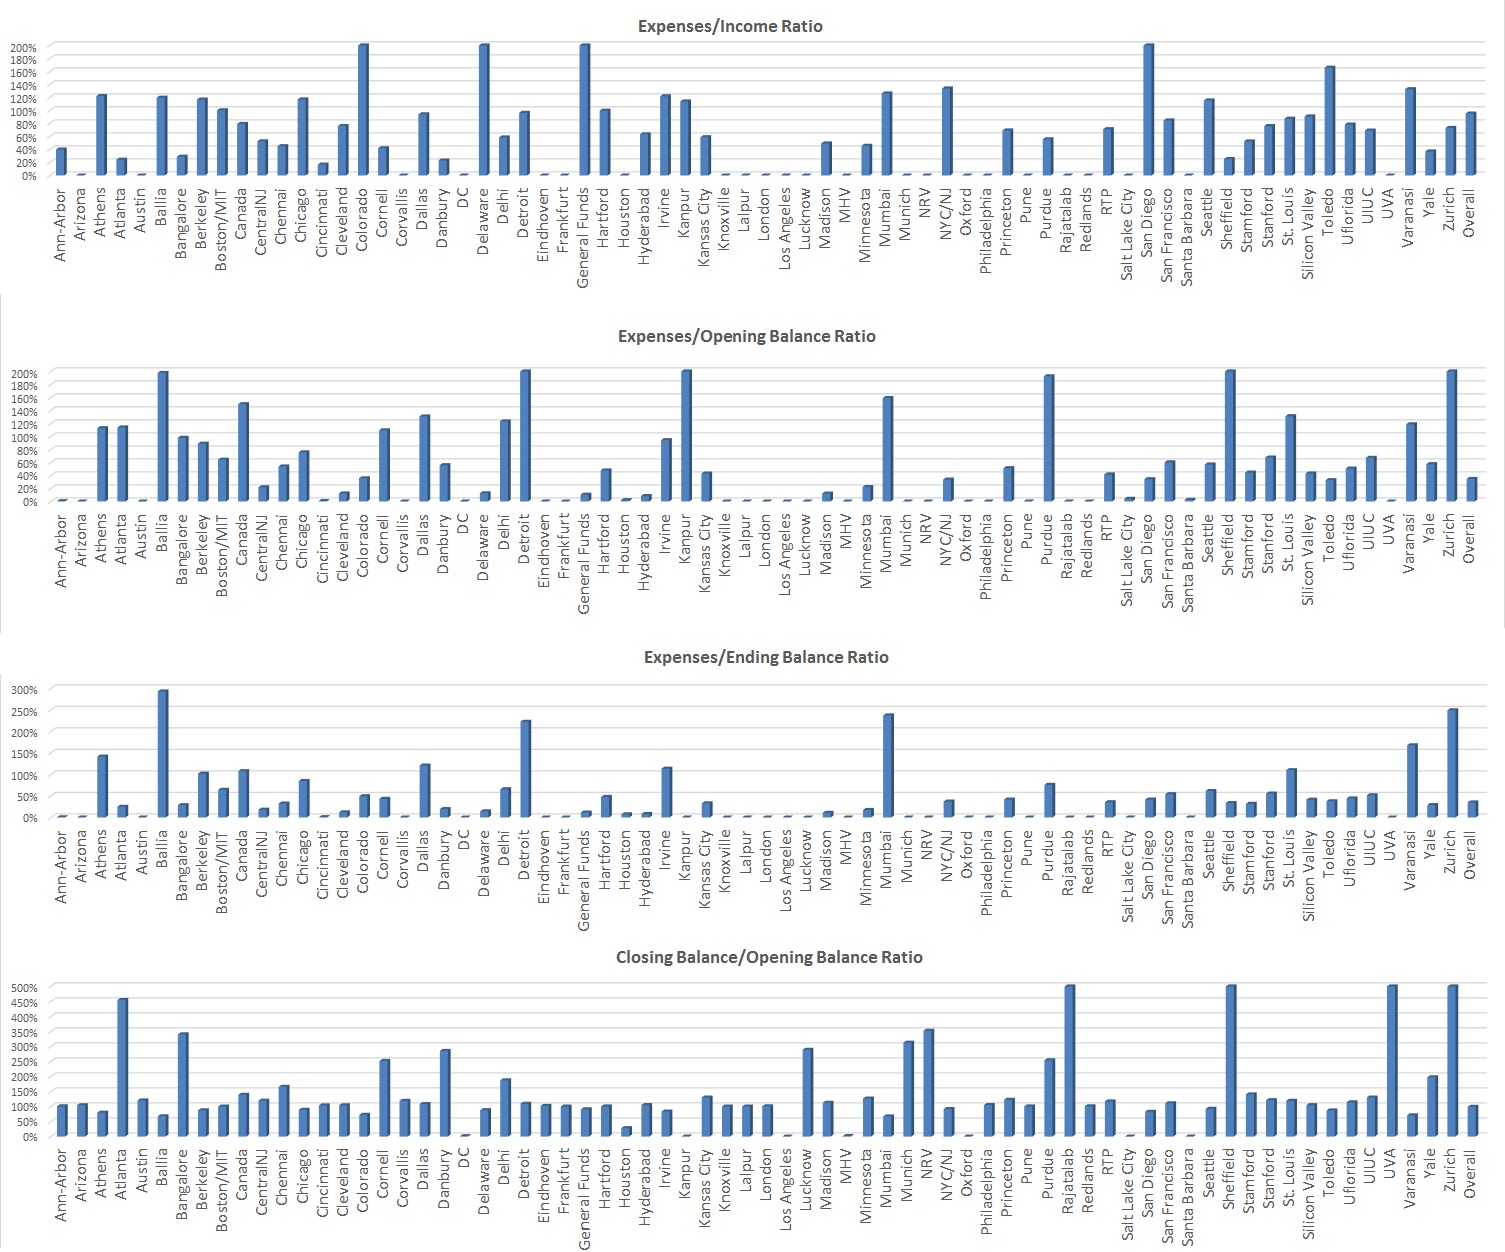
Income, Expense and Balance Ratios – By Chapter
The following graphs show some ratios of chapter expenses and income to reserves in 2014. Please note Asha chapters in Canada, Europe and India fundraise and disburse from both their local accounts and the U.S. account, but this statement is limited to activities in the U.S. only.
The following chapters were closed in 2014 – Corvallis, DC, Los Angeles, MHV, Oxford, Salt Lake City and Santa Barbara as seen in their closing balance. Chapters at Arizona, Austin, Houston, Knoxville, NRV, Philadelphia and UVA did not fund any projects in 2014.